
Streaming environmental air quality telemetry from the Cisco Catalyst 9136 Access Point
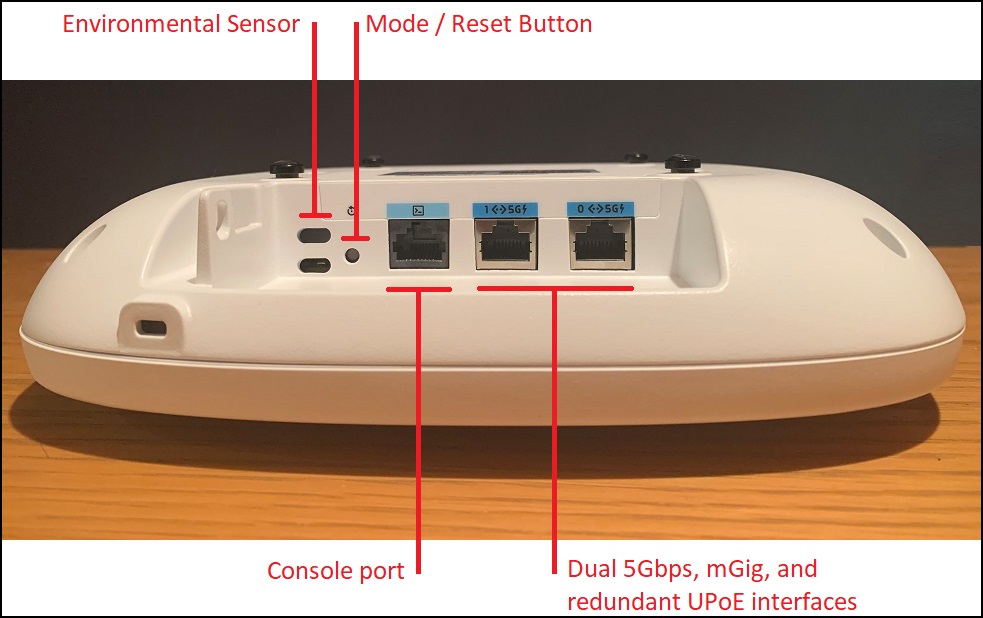
I’ve said this before - the Cisco Catalyst 9136 WiFi-6e Access Point is a big deal. The 9136 brings tonnes of new features to the party, including WiFi-6e, dual-mGig, PoE resiliency, and an Environmental Air Quality Sensor.
Regardless of your views about the COVID pandemic, the need for better ventilation and good quality air has become a key talking point, and as the saying goes, if you can’t monitor something, you can’t manage it. Cisco’s Catalyst 9136 WiFi-6e Access Point lets you do just that - monitor the air - because for the first time ever, this is a Cisco WiFi Access Point that includes an Environmental Air Quality Sensor. The AP’s Sensor reports on Temperature, Humidity, Total Volatile Organic Compounds and provides a calculated Indoor Air Quality index.
If you’re new to Air Quality monitoring (like I was!), you can learn more about it here https://www.renesas.com/us/en/document/whp/overview-tvoc-and-indoor-air-quality and here https://www.worldgbc.org/sites/default/files/bp-resource/BPFP-IEQ-Guidance-Note.pdf.
Air Quality Monitoring
Let’s get down to it; this is what I’m talking about. The ability to record and track various aspects of the quality of the air in your buildings. The Environmental Air Quality sensors in the 9136 provide you with the ability to monitor several aspects relating to Air Quality, including;
- Calculated Air Quality Metric (“IAQ”)
- Temperature (Deg C)
- Humidity (%)
- ECO2 (estimated CO2 - calculated based on TVOC)
- ETOH (estimated Ethanol)
- Total Volatile Compounds (“TVOC”, PPB)
- And thirteeen different RMOX values
All of this comes from the Catalyst 9136’s Environmental Sensor.
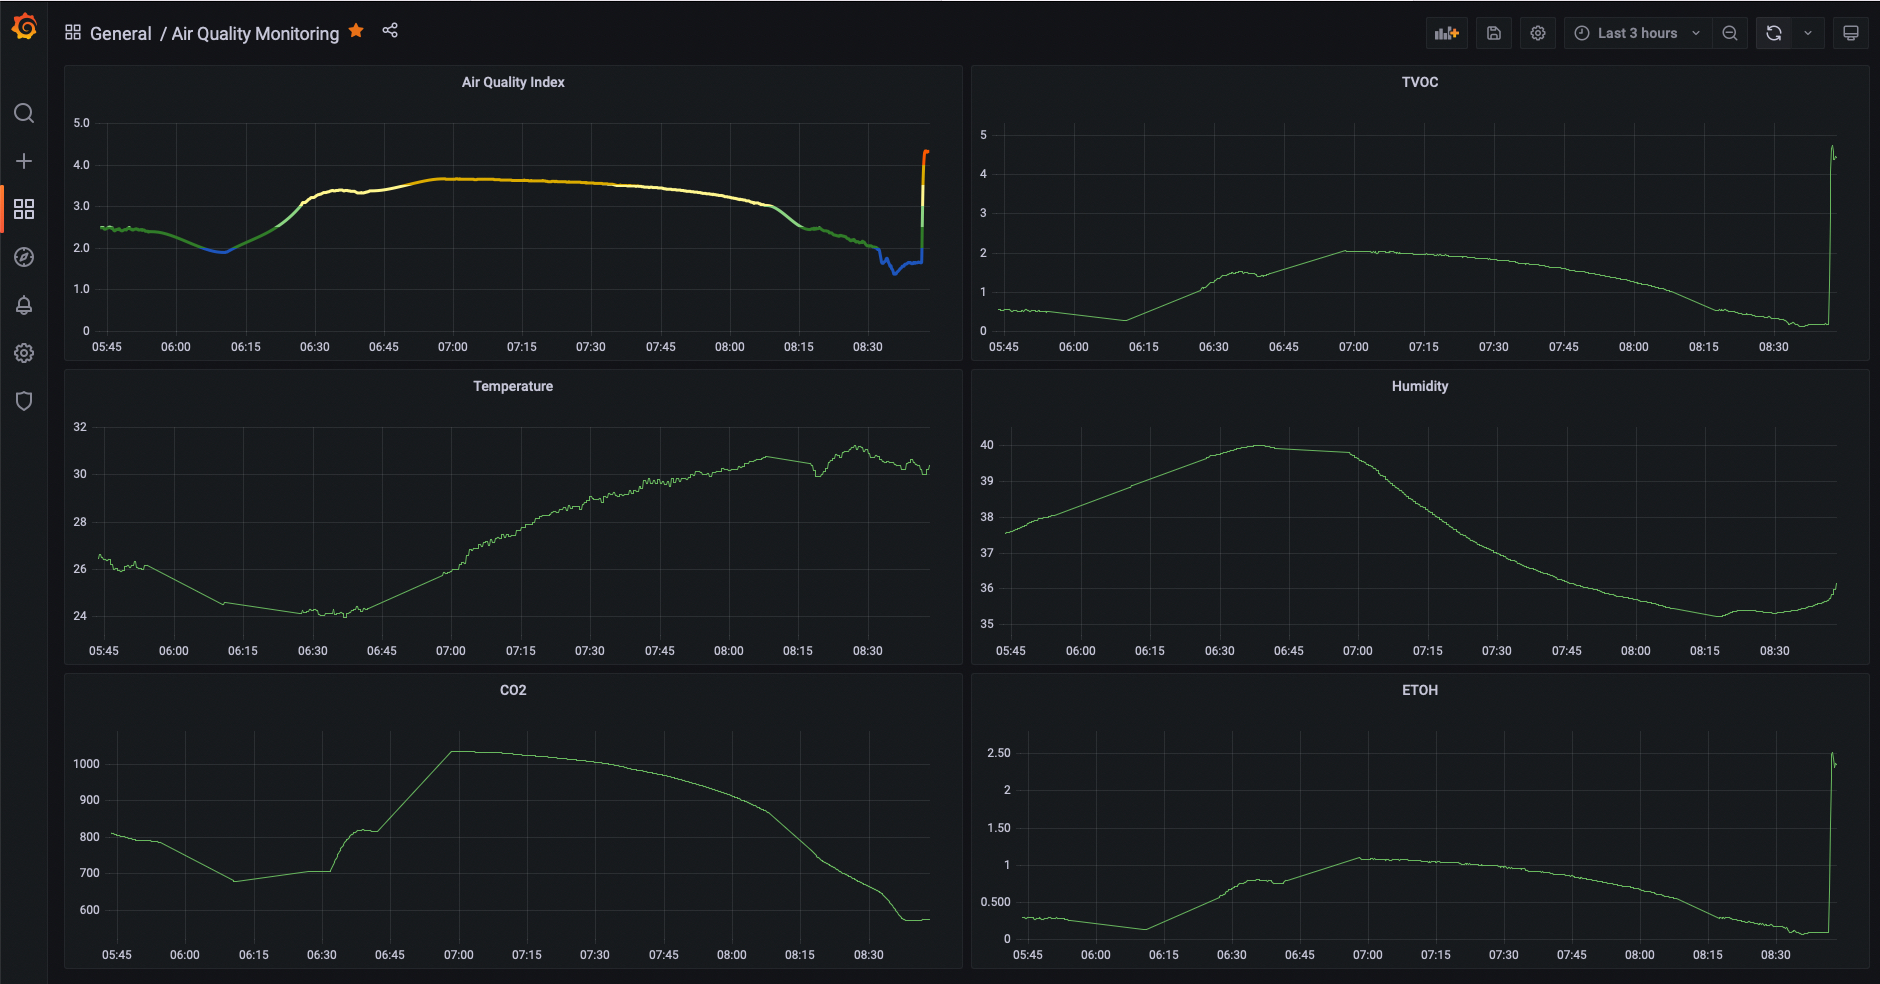
And what can you do with all of this data? Here’s one I made earlier…
Tech overview
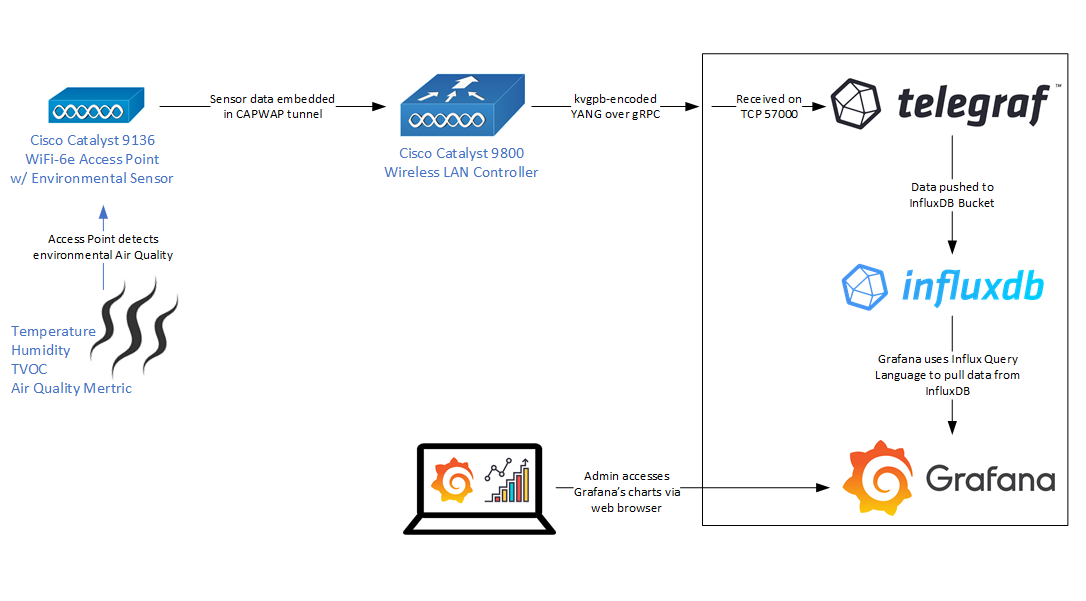
The key components in implementing this functionality are;
- Cisco Catalyst 9800 WLC running 17.8 or newer code (currently in Beta)
- Cisco Catalyst 9136 WiFi-6e Access Point with embedded Environmental Air Quality Sensor
- A TIG stack (Telegraf, InfluxDB & Grafana)
The Access Points’ sensors are only enabled from IOS-XE v17.8 so this is our minimum starting point in terms of software.
We’ll use the 9800 WLC to configure the WiFi Access Point so it sends its Sensor data to our TIG stack, and the TIG stack will store our data over time and allow us to produce some graphs, charts, and so on.
The TIG stack
“TIG” is a term for three products commonly used together to deliver dashboard-type services; Telegraf, InfluxDB and Grafana. This is how we’ll consume the data the Access Points generate.
Telegraf is a small, popular piece of software that we use to receive our streaming data and which pushes that data in to the database, InfluxDB.
InfluxDB is a popular time-series database. A time-series database is one that timestamps everything and allows you to run time-based queries on the data it holds.
Grafana is a popular dashboarding software that allows you to query a time series database and to draw various graphs and charts based on the data returned.
Implementation
Caution! This process is aimed it providing functionality, not security. Do not use these configs in production without hardening them first.
We’ll build out the “TI” parts of our stack first so we can receive and store data; InfluxDB first and Telegraf second. Once these are in place, we’ll build up the WLC config that actually allow us to send the Telemetry. We’ll verify this is all working ok before moving to the last step, building Grafana so we can visualise our data.
For the purposes of this install, the TIG stack is built on an M1 Mac Mini running Monterey 12.3. All software installs are managed through brew.
The instructions in this article are relevant to the following versions of software;
- Cisco 9800 IOS-XE v17.8 (Any kind of 9800 is ok; physical or virtual.)
- Grafana v8.4
- Telegraf v1.21.4
- InfluxDB v2.1.1
The gist of the process is the same for Windows and Linux, but the specific commands may differ slightly.
In my configs, the following addresses are used:
- Catalyst 9800 WLC - 192.168.1.70
- DNA Spaces Connector - 192.168.1.69
- Catalyst 9136 AP - 192.168.1.100
- Telegraf & InfluxDB - 192.168.1.224
InfluxDB
The first thing to install and setup is the database, InfluxDB. This is where we’ll store all of the Environmental Sensor data from all of the Access Points. Storing the data in a timeseries database gives you the ability to interact with the data and to see how it changes over time.
Install
The installation process is very easy:
brew update
brew install influxdb
Run
Once you’ve installed InfluxDB, run it:
influxd
Access
By default, InfluxDB will operate on local TCP port 8086 and it can be accessed using HTTP.
http://localhost:8086
Configure
Using the GUI, you’ll need to create an ‘organization’, a ‘bucket’ (the database where your data will be stored) and an API key so external things (like Telegraf and Grafana) can interact with your database.
The organization and bucker are both created in the install wizard when you first open the InfluxDB web page. API keys are created through Data > API Tokens > 'Generate API Token'.
Be sure to safely note down the values for all of these; you’ll need them later.
Telegraf
Telegraf is the second part of the installation process. Telegraph is a small piece of software that receives the telemetry data from the Access Point and inserts it in to the InfluxDB. There are two parts to this activity, installing Telegraf, and configuring Telegraf so it understands what we need it to do.
Install
brew update
brew install telegraf
Configure
Telegraf is small but mighty. We just need to tell it what sort of data to accept, and where to send it. We do this through a telegraf.conf file.
Create an empty file called telegraf.conf and fill it as shown below.
# Configuration for sending metrics to InfluxDB 2.0
[[outputs.influxdb_v2]]
  ## The URLs of the InfluxDB cluster node(s).
  ## Assuming you installed Telegraf on the same node as InfluxDB
  urls = ["http://127.0.0.1:8086"]

  ## Token for authentication.
  token = "Your_InfluxDB_API_Key_Goes_Here"

  ## Organization is the name of the organization you wish to write to.
  organization = "Your_InfluxDB_Organisation_Name_Goes_Here"

  ## Destination bucket to write into.
  bucket = "Your_InfluxDB_Bucket_Name_Goes_Here"

[[inputs.cisco_telemetry_mdt]]
  transport = "grpc"
  service_address = ":57000"
Run
Run telegraf and point it at the telegraf.conf file you just made.
telegraf --config ./telegraf.conf
9800 Wireless LAN Controller
Running software v17.8 or newer with a Catalyst 9136 WiFi-6e Access Point, we need to do a few things;
- Enable netconf-yang
- Setup aaa for netconf-yang
- Create a telemetry subscription that will instruct the Access Point on what data to send, when, where and how.
Configure
SSH/Console to the 9800 WLC and create the config shown below. I assume the WLC already has an IP address, network connectivity, an enable secret and a local Priv 15 user defined.
Enable netconf-yang
Enable netconf-yang on the WLC. This uses TCP 830.
conf t
netconf-yang
Setup aaa for netconf-yang
netconf-yang provides a way for things to interact with your WLC and it is just as powerful (or vulnerable) as SSH or HTTPS is. With this in mind, we need to provide the WLC with some information about how to authenticate netconf-yang connections. In this example, we’re going to assume that we’re just using local credentials on the WLC for everything.
Netconf on the 9800 only ever uses the default method.
conf t
aaa new-model
aaa authorization exec default local
aaa authentication login default local
Enable the sensors
Sensors are enabled within the Access Point Join Profile. For the purposes of this exercise, I’m using the ‘default-ap-profile’ Join Profile.
9800# conf t
9800(config)# ap profile default-ap-profile
9800(config-ap-profile)# sensor environment air-quality
9800(config-ap-profile)# sensor environment temperature
Enable telemetry
Create ietf telemetry subscriptions in the WLC that will send the telemetry data to Telegraf.
conf t
telemetry ietf subscription 20
 encoding encode-kvgpb
 filter xpath /wireless-access-point-oper:access-point-oper-data/ap-temp
 source-address 192.168.1.70
 stream yang-push
 update-policy periodic 5000
 receiver ip address 192.168.1.224 57000 protocol grpc-tcp

telemetry ietf subscription 21
 encoding encode-kvgpb
 filter xpath /wireless-access-point-oper:access-point-oper-data/ap-air-quality
 source-address 192.168.1.70
 stream yang-push
 update-policy periodic 5000
 receiver ip address 192.168.1.224 57000 protocol grpc-tcp
Here’s a breakdown of what these commands are doing:
telemetry ietf subscription 20: this is the subscription ID that groups together all the config to stream one set of data
encoding encode-kvgpb: this matches the encoding specified inside “cisco_telemetry_mdt”, that is used by telegraf. “KVGPB” stands for Key Value Google Protocol Buffer.
filter xpath /wireless-access-point-oper:access-point-oper-data/ap-air-quality: this is the data we want to send
source-address 192.168.1.70: this is where we want to send the data from (ie, the WLC’s Management Interface)
stream yang-push: stream the data using yang
update-policy periodic 5000: send new data every 5 seconds
receiver ip address 192.168.1.224 57000 protocol grpc-tcp: send the data to the DNA Spaces Connector (192.168.1.69) on the port that telegraf is listening on (TCP 57000) using grpc-tcp (which is reliable, but insecure).
Validation
Validate your 9800 config with the commands shown below. Each output includes a corresponding expected / good output.
Take a high level view of your configs and if the WLC thinks they’re valid or not
9800# show telemetry ietf subscription summary

Subscription Summary
====================
Maximum supported: 128

Subscription     Total       Valid      Invalid
-----------------------------------------------
All              2           2          0
Dynamic          0           0          0
Configured       2           2          0
Permanent        0           0          0
Take a slightly closer look at your configs and if the WLC thinks they’re valid or not
9800# show telemetry ietf subscription all

ID         Type       State      State Description
20         Configured Valid      Subscription validated
21         Configured Valid      Subscription validated
Take a detailed look at subscription 20. Anything other than “Connected” as the State is an error of some kind.
9800# show telemetry ietf subscription 20 detail

Telemetry subscription detail:

  Subscription ID: 20
  Type: Configured
  State: Valid
  Stream: yang-push
  Filter:
    Filter type: xpath
    XPath: /wireless-access-point-oper:access-point-oper-data/ap-temp
  Update policy:
    Update Trigger: periodic
    Period: 5000
  Encoding: encode-kvgpb
  Source VRF:
  Source Address: 192.168.1.70
  Notes: Subscription validated

  Named Receivers:
    Name                                              Last State Change  State                 Explanation
    -------------------------------------------------------------------------------------------------------------------------------------------------------
    grpc-tcp://192.168.1.224:57000                    03/21/22 17:04:23  Connected
Take a detailed look at subscription 21. Anything other than “Connected” as the State is an error of some kind.
9800# show telemetry ietf subscription 21 detail

Telemetry subscription detail:

  Subscription ID: 21
  Type: Configured
  State: Valid
  Stream: yang-push
  Filter:
    Filter type: xpath
    XPath: /wireless-access-point-oper:access-point-oper-data/ap-air-quality
  Update policy:
    Update Trigger: periodic
    Period: 5000
  Encoding: encode-kvgpb
  Source VRF:
  Source Address: 192.168.1.70
  Notes: Subscription validated

  Named Receivers:
    Name                                              Last State Change  State                 Explanation
    -------------------------------------------------------------------------------------------------------------------------------------------------------
    grpc-tcp://192.168.1.224:57000                    03/21/22 17:06:04  Connected
Check the WLC actually has some air quality data from the AP. If the tables are empty, there’s something wrong.
9800# show platform software process database odm chassis active r0 details EWLC_OPERATIONAL_DB "table tbl_ap_air_quality" content

Database: EWLC_OPERATIONAL_DB - Table: table tbl_ap_air_quality - Num Recs: 1

Records
-------------------------------------------------------------------------------------------------------
791 record@tbl_ap_air_quality: {
  st_ap_air_quality@st_ap_air_quality: {
    ap_mac@tdl_mac_addr: {
      mac[0]@U8:104
      mac[1]@U8:125
      mac[2]@U8:180
      mac[3]@U8:95
      mac[4]@U8:220
      mac[5]@U8:160
    }
    last_update@calendar_time: {
      second@I64:1647884273
      microsec@U32:816370
    }
    rmox_0@LF:1018991936.000000
    rmox_1@LF:90387552.000000
    rmox_2@LF:14352000.000000
    rmox_3@LF:3086827.500000
    rmox_4@LF:846708.500000
    rmox_5@LF:266985.437500
    rmox_6@LF:102353.226500
    rmox_7@LF:283437.281200
    rmox_8@LF:907912.437500
    rmox_9@LF:3295409.000000
    rmox_10@LF:15411923.000000
    rmox_11@LF:97635200.000000
    rmox_12@LF:1111646592.000000
    iaq@LF:3.051500
    etoh@LF:0.633100
    eco2@LF:405.124300
    tvoc@LF:1.190300
  }
}
Check the WLC actually has some AP temperature data from the AP. If the tables are empty, there’s something wrong.
9800# show platform software process database odm chassis active r0 details EWLC_OPERATIONAL_DB "table tbl_ap_temperature" content

Database: EWLC_OPERATIONAL_DB - Table: table tbl_ap_temperature - Num Recs: 1

Records
-------------------------------------------------------------------------------------------------------
369 record@tbl_ap_temperature: {
  st_ap_temperature@st_ap_temperature: {
    ap_mac@tdl_mac_addr: {
      mac[0]@U8:104
      mac[1]@U8:125
      mac[2]@U8:180
      mac[3]@U8:95
      mac[4]@U8:220
      mac[5]@U8:160
    }
    last_update@calendar_time: {
      second@I64:1647884323
      microsec@U32:836096
    }
    temp@LF:28.743200
    humidity@LF:39.496500
  }
}
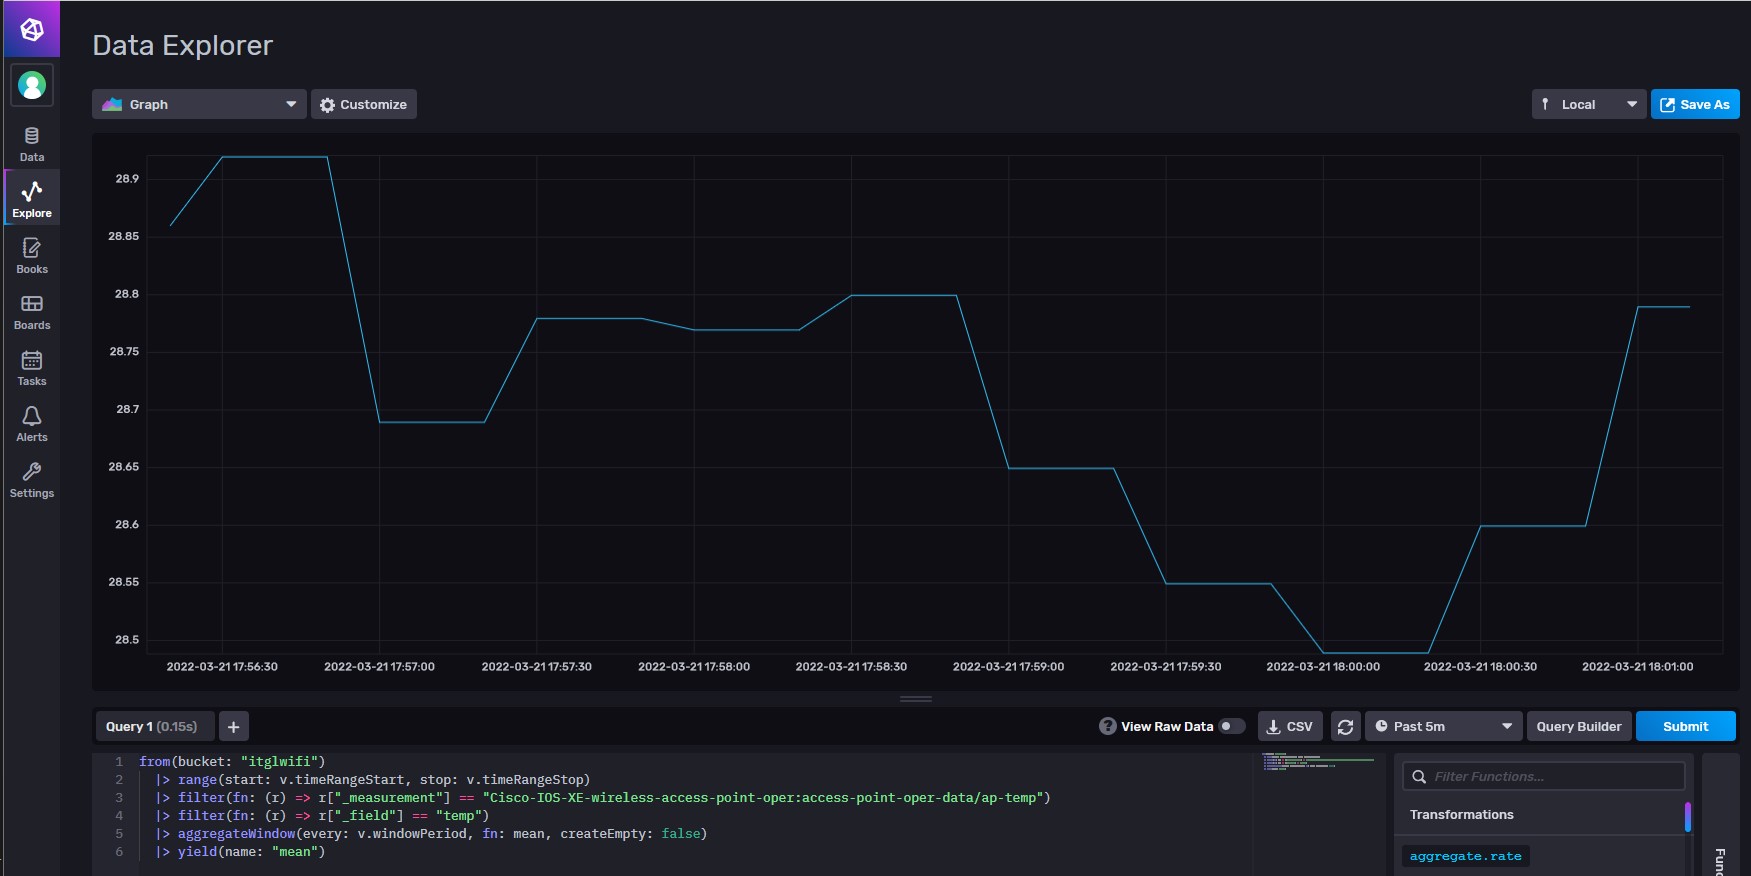
Lastly, if all of those outputs look ok, check InfluxDB to ensure you are receiving data.
Go to the influxDb webpage navigate to the data explorer. You should be able to select and visualise your data, like this.
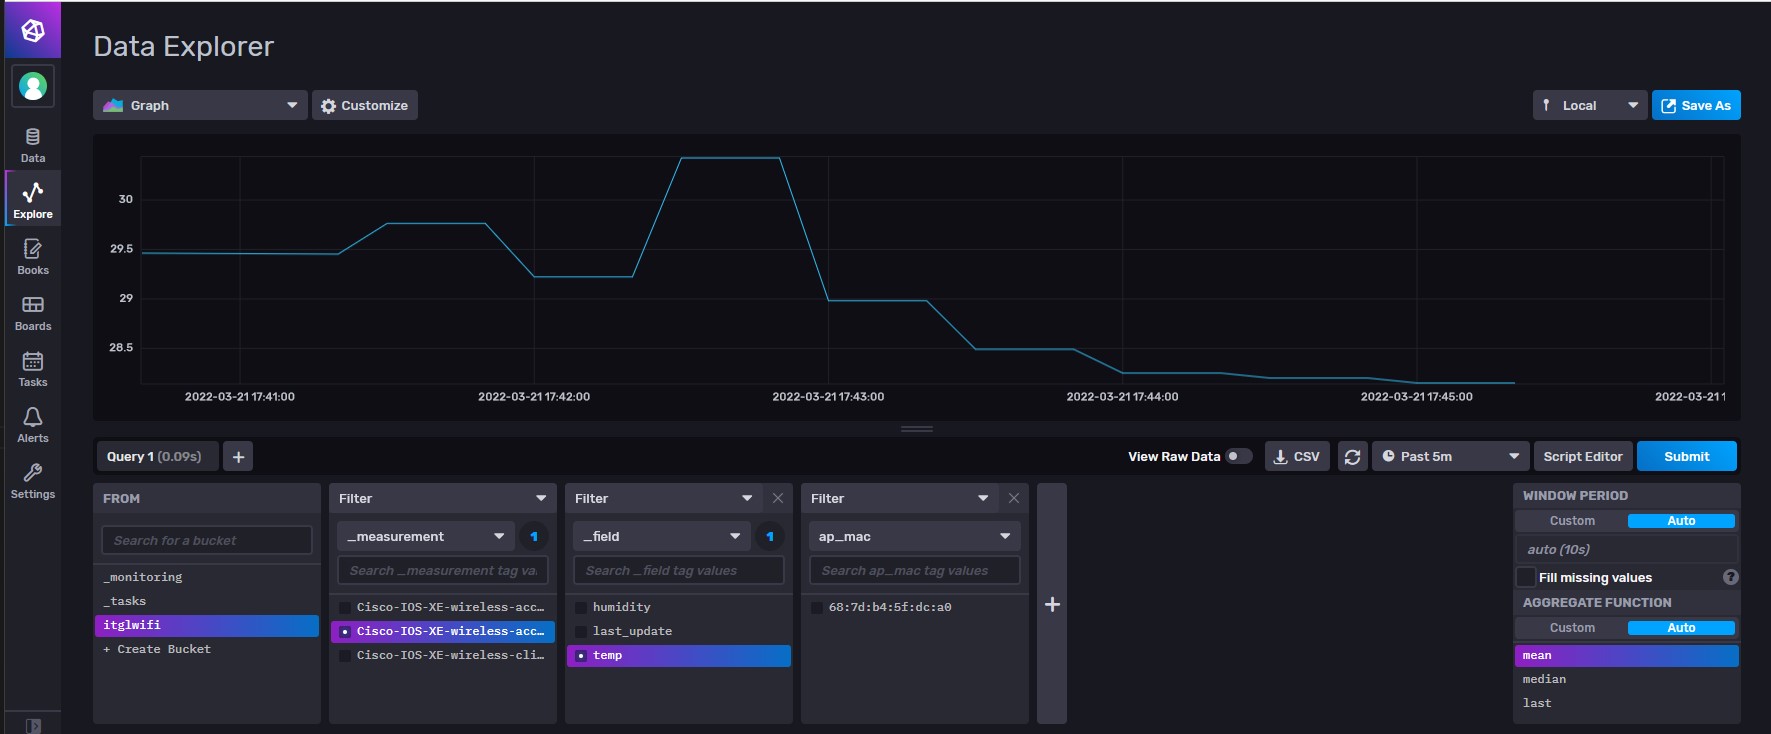
If you’ve got this far - great. Time to setup some proper graphs in Grafana.
Grafana
Install
brew update
brew install grafana
configure
Log in to the Grafana GUI using your web browser; it will default to using TCP 3000.
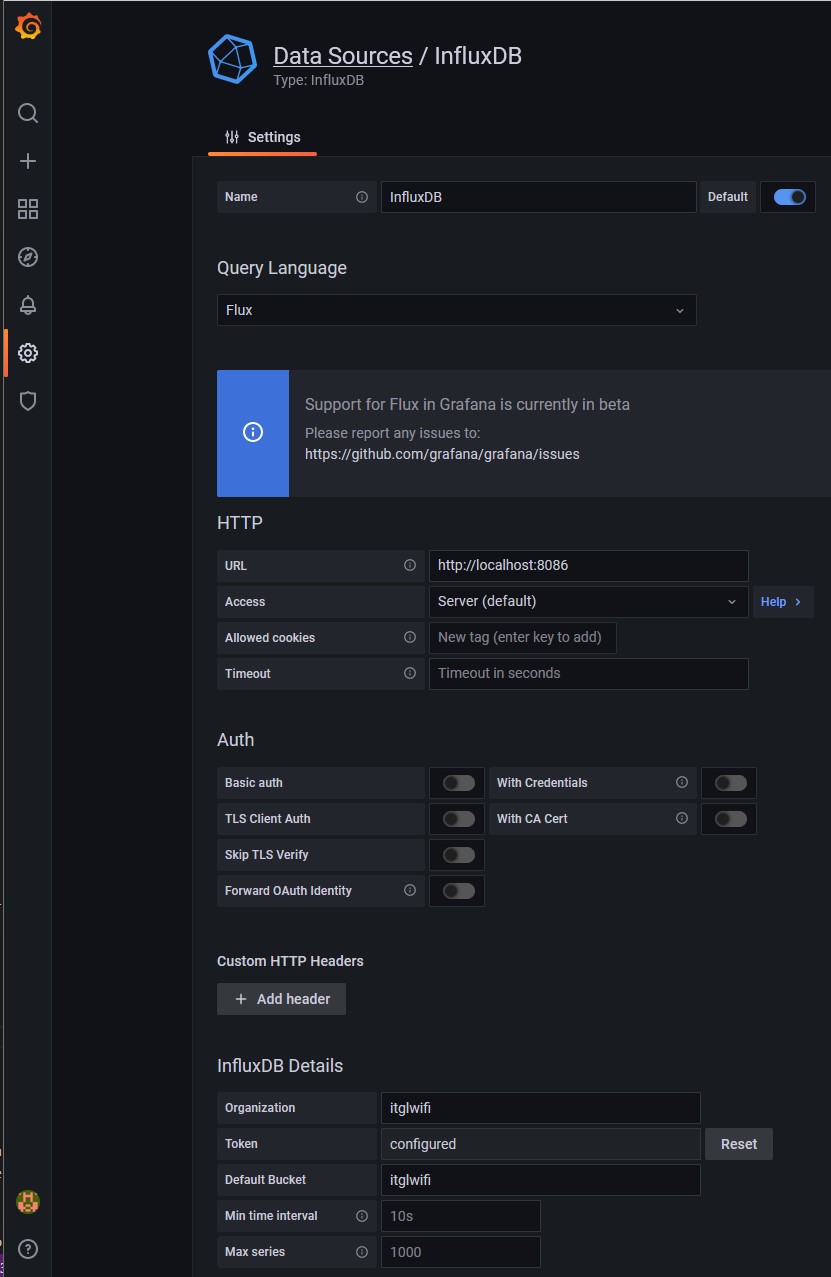
Navigate to Configuration > Data Sources > Add data source > InfluxDB to define how Grafana will interact with InfluxDB.
In my environment, Grafana and InfluxDB are on the same host, so I can use localhost:8086 as the location of InfluxDB. Change this as necessary to suit your environment.
Leave all of the Auth settings alone / off.
Configure the InfluxDB details with the settings you noted down when you first configured InfluxDB. Note that Token is where your API key should be used.
Now you have the database relationship in place, we can build some charts.
To build a chart, you first need to be able to query the database for some specific data. To do this, we use Influx Query Language. You don’t really need to learn Influx Query Language though because InfluxDB gives us a nice GUI and it’ll produce the script for us.
Go back to the Data Explorer in the InfluxDB GUI and build out a data series that you’re interested in. Once you have a set of data you’re happy with, click the Script Editor button on the right hand side of the screen and the query is presented on screen for you to copy / paste. Note that after you click the Script Editor button, it changes to say Query Builder.
Copy the Query and go back to the Grafana GUI.
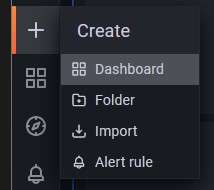
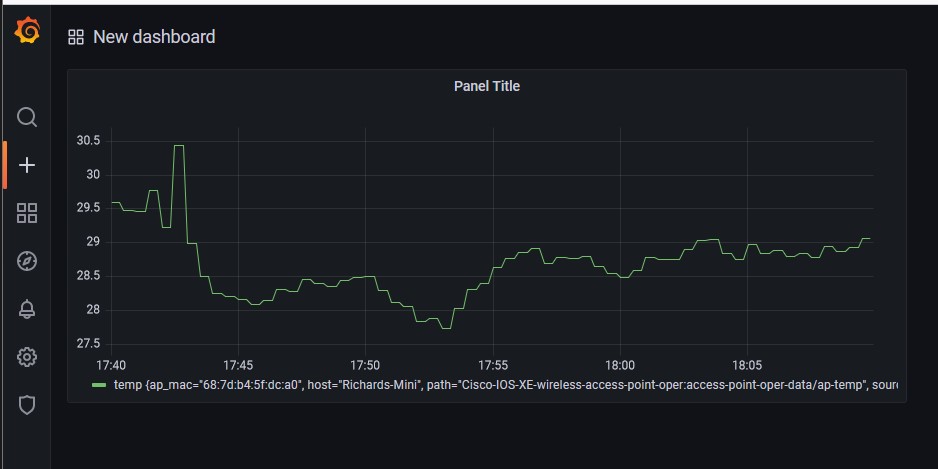
Create a new dashboard for yourself; this is where we’ll store all of your charts.
Grafana will then load an empty Dashboard. Click the add a new panel icon and in the following page, insert your query in to the empty box at the bottom of the page and then click the circular refresh button towards the top left to see your data.
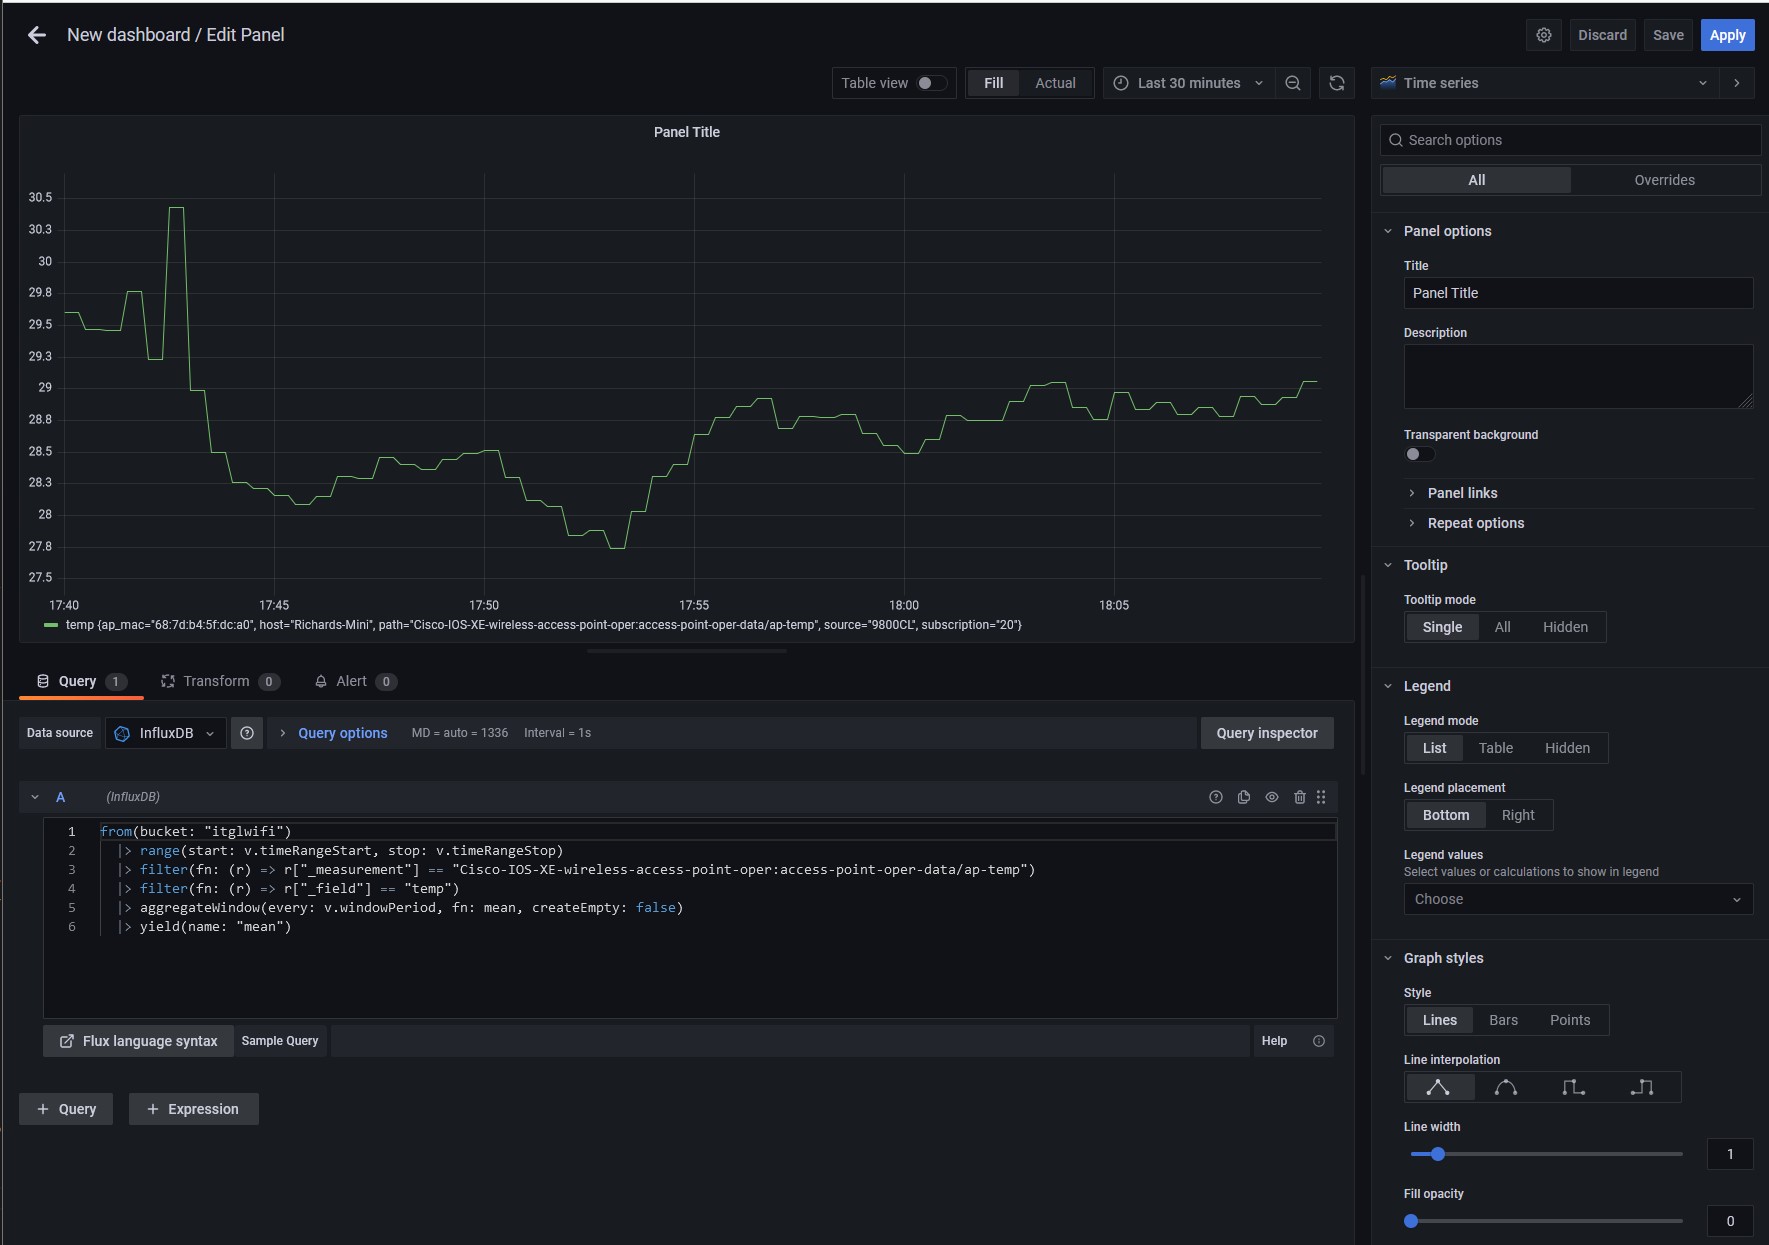
You can use the menu on the right hand side to to tailor how your chart looks, and you can use the time selector at the top right to control the timespan your data covers. Once you’re happy, click the blue Apply button at the top right. The page will reload, showing your new Panel in your new Dashboard.
Rinse and repeat this process a few times and you can build out lots of panels in your dashboard.
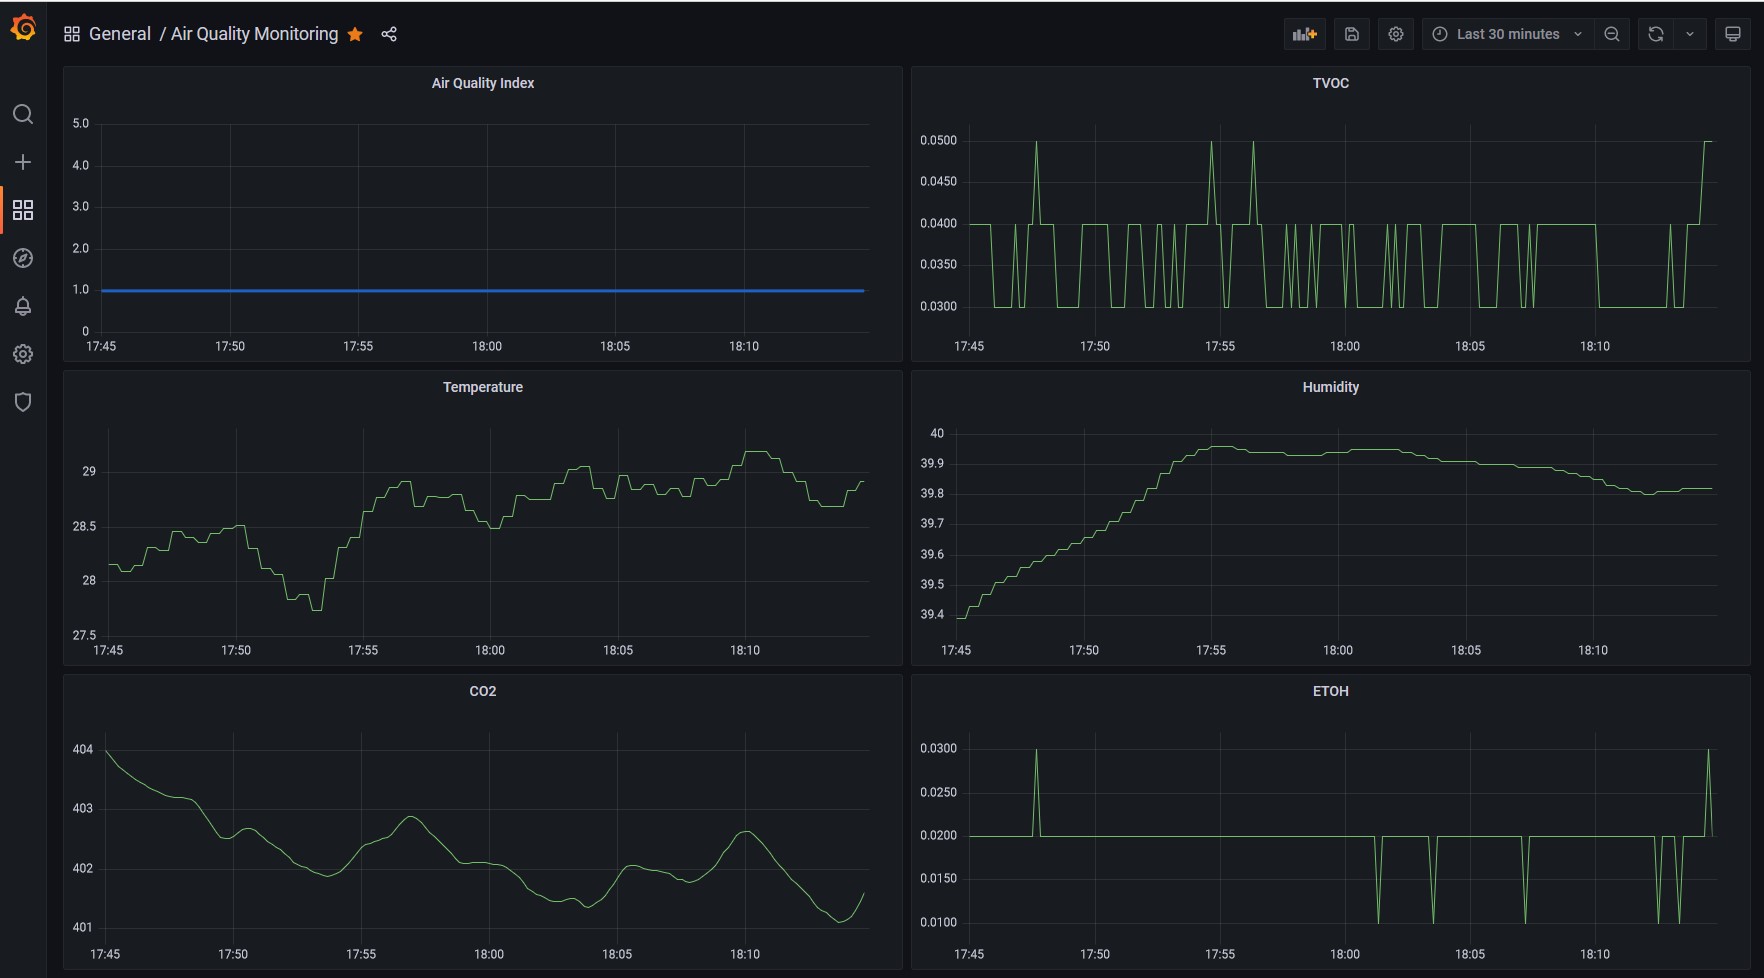
And that’s it! You’ve now got data streaming in and you can build all sorts of charts / graphs / tables to help you make sense of the data and to draw value from it.
Limitations
Implementing environmental sensors in this way is new and there are bound to be drawbacks.
Firstly there’s the sensor itself. It’s possible to spend a small fortune on finitely accurate Sensors and clearly Cisco haven’t embedded a $5k sensor in to each Access Point. This will inevitably lead to variations in the relative and absolute quality of the data compared to high end equipment, though I have to say from what I’ve seen in my own testing, the accuracy of the data is more than good enough for normal IoT use cases.
Second is the position of the Sensor. We’re interested in Air Quality monitoring because it impacts human beings, but the Sensor being embedded in a WiFi Access Point which means the Sensor’s view of the world won’t be the same as a persons’. Access Points are typically ceiling mounted some distance higher than the people in the room which means there will be some difference between the air the sensor monitors and the air the people are breathing. The scale of these differences will depend on how still or turbulent the air is, the height difference between the people and where the Access Point is mounted. For normal IoT use cases though, this is probably not an issue.
Third is the position of the Sensor (again). The sensor its self is hidden away near the Access Point’s dual-mGig Ethernet sockets, which means it is less likely to be immediately influenced by moving air (like a breeze through a window), and as the sensor may succumb to ‘out of sight, out of mind’ thinking, there’s a chance the sensor’s ports could get clogged with dust and other obstacles that could skew its readings. Even the orientation of the Access Point (face up, face down or wall mounted) or its install location (above a radiator, below an air con unit, in the sun, near/far from a door or window, in an enclosure, etc etc) will impact the data it produces. Appreciating these factors will be a key consideration come Survey and Installation time.
I don’t see any of these factors from significantly detracting from the usefulness of the data the sensor produces.
What’s next?
In a subsequent blog post I’ll take a look at a much easier way of doing all of this via DNA Spaces. I’ll also look at how you can build systems that automatically react to changes in the data and discuss how this kind of automation can benefit you, your Users, your Energy bills and your Estate overall.
Thank you
A lot of this wouldn’t have been possible without some fantastic support from all sorts of people inside Cisco, as well as from some awesome Cisco Champions, including @mrTeign and this article from @baldwifiguy.